Histograms app for iPhone and iPad
Developer: Brainingcamp, LLC
First release : 24 May 2012
App size: 10.38 Mb
Everything you need for teaching and learning: (1) Narrated lesson (2) Practice questions (3) Virtual manipulative (4) Challenging game
★ TOPICS COVERED ★
1. Understand that a histogram is a type of graph that shows the frequency distribution of data within equal intervals
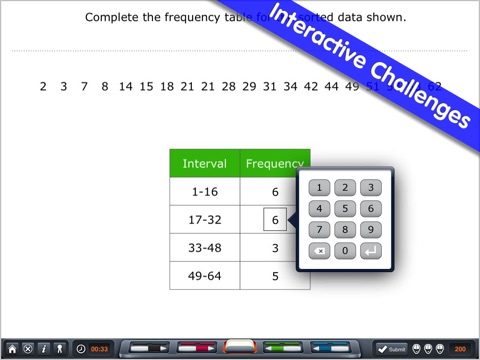
2. Create a frequency table from a set of data
3. Construct a histogram from a frequency table
4. Understand how to analyze a histogram
5. Know that the size of the intervals impacts the shape of the histogram
★ FEATURES ★
✔ Lesson with visual models and audio narration to make abstract concepts concrete
✔ Questions to practice what was learned
✔ Virtual manipulative for hands-on discovery learning
✔ Game to interactively apply understanding
✔ Alignment with state and Common Core standards
✔ Suitable for ages 9-14


